ER diagram
An entity-relationship diagram is a picture of the things a system stores and the connections between them: each entity becomes a box listing its attributes, and a line between two boxes says records of one relate to records of the other. The marks on the line ends say how many.
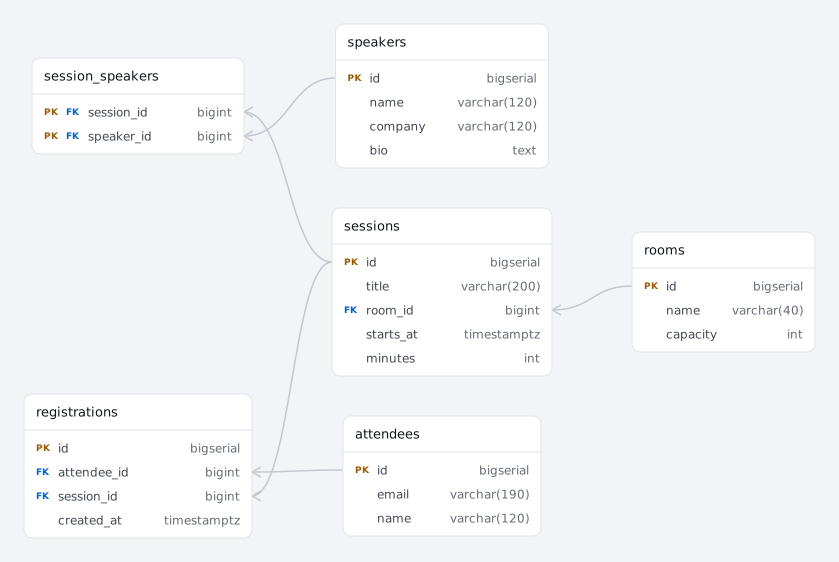
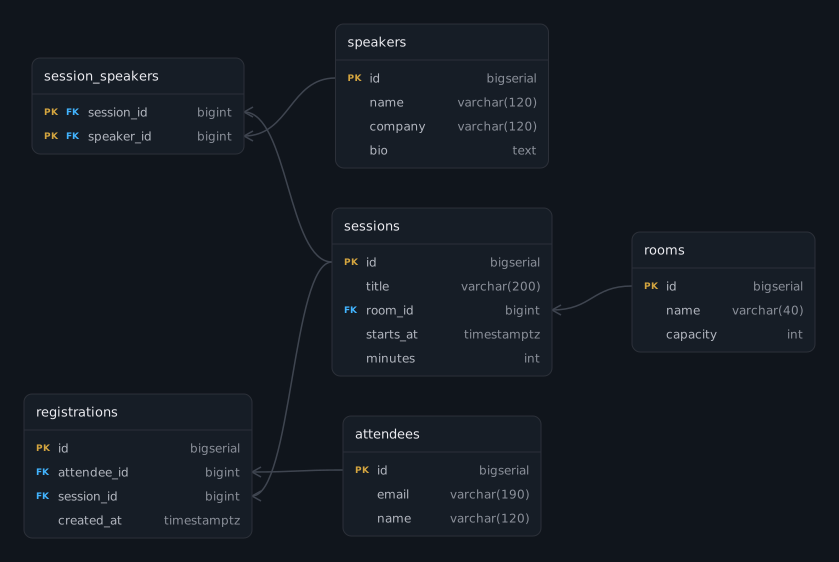
A conference schedule, generated from the SQL beside it. Paste your own schema over it.
What are the three parts of an ER diagram?
Every ER diagram is built from the same three pieces, whatever notation draws them.
- Entity — a thing worth storing separately. In the diagram above: a speaker, a room, a session. In a database it becomes a table.
- Attribute — something known about that thing. A speaker has a name and a company; these become columns, each with a type.
- Relationship — a connection between two entities. A session happens in a room. In a database this becomes a foreign key, and it is the line on the diagram.
How do you read the line ends?
Crow’s foot notation is what most tools draw, and two rules cover it: the symbol closest to the box is the maximum (a bar is one, a crow’s foot is many), and the outer symbol is the minimum (a bar means at least one, a circle means zero is allowed). Read each end on its own, as a sentence about the box at the far side.
sessions: a room hosts zero or many sessions. Toward rooms: a session happens in exactly one room — the bar and the crow’s foot are answering different questions.The full set of marks, including the Chen and UML equivalents, is on ER diagram symbols; the two reading rules are worked through in detail on crow’s foot notation.
Where does many-to-many go?
This is the question coursework asks and real schemas answer differently, so it is worth seeing both. A speaker may give several sessions, and a session may have several speakers. A conceptual ER diagram draws that as one relationship with a crow’s foot at both ends — a single connection, no extra box.
A database cannot store that. The relationship becomes a junction table of its own: in this conference-schedule example that table is session_speakers, and its primary key is made of both foreign keys. That is the difference between a conceptual model and a schema diagram: one shows the intention, the other shows what was built.
What is an ER diagram in DBMS coursework?
The same diagram, taught in three levels. A conceptual model names entities and relationships only. A logical model adds attributes, primary keys and the join tables that many-to-many requires. A physical model commits to one engine, with real types — varchar(190), timestamptz — and indexes.
ErdDocs always produces the physical one, because it reads a real schema and reports what is in it. If an assignment asks for the conceptual level, draw that by hand: it is a modeling exercise, and no generator can recover a decision you have not made yet. Everything the other two levels ask for is already decided in a database that exists — attributes, primary keys, the join tables many-to-many became, and the engine’s own types — and ErdDocs takes all of it straight from the schema file.
How do you make an ER diagram from an existing database?
- 01Find the schema as text — a
pg_dump --schema-onlyfile, aschema.prisma, a migrations folder, or the model files of Django, SQLAlchemy, Sequelize or TypeORM. - 02Paste it into the panel above. The format is detected as you type; the diagram draws itself, and export gives PNG, SVG, Mermaid, DBML or PlantUML. All of it runs in your browser — the schema is never uploaded.
FAQ
What is an ER diagram?
An entity-relationship diagram is a picture of the things a system stores and the connections between them. Each entity — a customer, an order, a course — becomes a box listing its attributes, and a line between two boxes says that records of one relate to records of the other. The marks on the ends of that line say how many: one, many, or optionally none.
What does ERD stand for?
Entity-Relationship Diagram. The model behind it was introduced by Peter Chen in 1976, and the abbreviation ERD is used interchangeably with "ER diagram" and, loosely, with "schema diagram" — although the last one properly means something narrower.
What is an ER diagram in DBMS?
The same thing, described from the database side: a diagram of the tables a database management system will hold, their columns, and the foreign keys joining them. Coursework often distinguishes three levels — conceptual (entities only), logical (attributes and keys) and physical (actual types for a specific engine) — and the same drawing convention is used at all three.
How do I read the marks on the line ends?
Two rules cover crow’s foot notation, which is what most tools draw. The symbol closest to the box is the maximum: a bar means one, a crow’s foot means many. The outer symbol is the minimum: a bar means at least one, a circle means zero is allowed. Read each end separately, and read it as a sentence about the box at the other end.
Do I have to draw one by hand?
Not if the database already exists. Given the schema as text — a dump, a Prisma schema, a folder of migrations or ORM model files — ErdDocs generates the diagram from it in a second, and regenerates it whenever the schema changes. Drawing by hand is for design; generating is for documenting what was built.
Is the generator free?
Diagrams up to 25 tables render in full with no account, and PNG and SVG exports are free. Bigger schemas are parsed completely, with the tables past the limit shown as locked placeholders, and $9 once lifts the limit and unlocks the printable data dictionary.
Related
- ER diagram examples — eleven complete schemas, each with the SQL behind it and one modeling decision to learn from.
- ER diagram symbols — every mark and what it means, in crow’s foot, Chen and UML.
- ER diagram cardinality — cardinality versus participation, and which DDL decides each mark.
- ER diagram tool — the generator compared with the drawing suites.
- Schema diagram — where the conceptual model ends and the built database begins.
- SQL to ER diagram — the tool with all ten formats it reads.