Schema diagram
A schema diagram is a picture of a database as it is actually built — every table a box, every column with its type, and a line wherever one table references another. Paste the schema you already have and it is drawn for you, in any of ten formats, without a database connection and without anything leaving your browser.
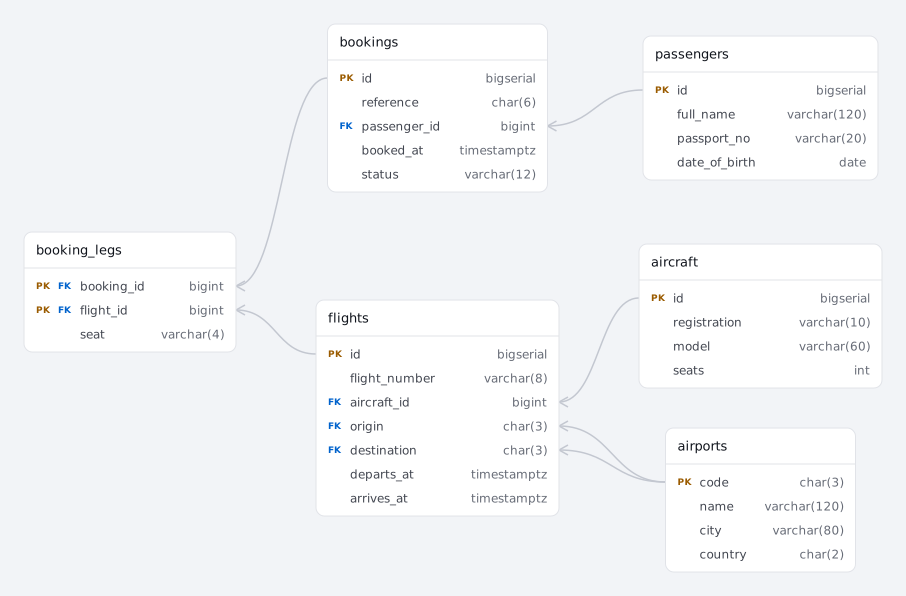
An airline booking schema. Paste yours over it — or drop a file onto the panel.
Schema diagram vs. ER diagram — is it the same thing?
Not originally, though in everyday use the two names have collapsed into one. An entity-relationship diagram, in the sense Peter Chen defined it in 1976, is a modeling artifact: it describes entities and relationships before anyone decides how to store them, and a many-to-many relationship is a single diamond with no foreign key anywhere, because foreign keys are an implementation detail that has not happened yet. A schema diagram describes what was built instead — the diamond has become a join table, such as a booking_legs table holding one row per flight leg of a booking, which a conceptual model would never draw and a real database cannot work without. Most products sold as “ER diagram tools” draw schema diagrams with crow’s foot marks, not Chen diagrams; ErdDocs always does, because it reads a schema rather than inventing the concept that came before it.
| ER diagram (Chen, 1976) | Schema diagram | |
|---|---|---|
| Represents | a concept, before storage decisions | the tables a database actually holds |
| Many-to-many | one diamond | a join table, e.g. booking_legs |
| Foreign keys | none — not decided yet | shown, with crow’s foot marks |
| Made by | drawing, before the schema exists | generating, from a schema that exists |
| Goes stale when | requirements change | never — regenerate by pasting again |
Two steps, and neither is drawing
- 01Get the schema as text. From a live database that is
pg_dump --schema-onlyormysqldump --no-data; from a project it is already there, as a Prisma schema, a migrations folder or the ORM model files. - 02Paste it. The format is detected as you type and the diagram appears; drag boxes if the arrangement matters, then export PNG or SVG, or switch to Data Dictionary for the printable written version.
What the diagram tells you about each table
Everything a schema states about structure, and nothing it does not:
- Columns with their real types —
char(3),timestamptz,varchar(120)as they were written, not flattened into a generic “string”. - Keys, including composite ones — the primary key of
booking_legsis the pair of columns, which is what makes it a join table rather than a table that happens to have two references. - Which end holds the key — crow’s foot marks put the many side where the foreign key actually lives, so the direction is readable without opening the DDL.
- Declared versus guessed relations — a line the database really constrains is solid; a line recovered from column naming, because the schema declares no foreign keys at all, is dashed and stays dashed.
- Two references to the same table —
flightspoints atairportstwice, for origin and destination, and both lines are drawn rather than merged into one.
Why generate it instead of drawing it?
A drawn diagram is correct on the day it is drawn. The next migration makes it wrong, and nothing tells you — the picture keeps looking authoritative while the database moves underneath it. That is why the diagram in a wiki is usually eighteen months old.
A generated diagram has no such gap: ErdDocs produces it from the schema itself, so redoing it costs one paste — and if the schema already exists, drawing it by hand is copying a document you already own. Designing something that does not exist yet is the other job, and a drawing tool is the right instrument for it — see the honest comparison on the ERDPlus alternative page.
FAQ
What is a schema diagram?
A schema diagram is a picture of a database as it is actually built: every table as a box, every column with its type, and a line wherever one table references another. It describes the physical structure — what the server would create — rather than an idea of the data, which is why it can be generated from a schema file instead of drawn by hand.
Is a schema diagram the same as an ER diagram?
Not originally, though almost everyone now uses the words interchangeably. A true entity-relationship diagram, in the sense Peter Chen defined in 1976, models entities and relationships before any decision about tables — a many-to-many relationship is a diamond, and no foreign key exists yet. A schema diagram shows the tables that resulted, including the join table that many-to-many actually became. Most tools sold as “ER diagram tools” draw schema diagrams; ErdDocs always does, because it reads a schema.
Can it draw a diagram of a database I have no connection to?
That is the normal case here. ErdDocs never connects to a server: the input is text — a dump, a Prisma schema, a folder of migrations, ORM model files — which is what you have when the schema arrived by email, sits in a repository you cloned, or belongs to a client whose credentials you will never hold.
What does the diagram show about each column?
The name, the type as it was written, whether it is nullable, and whether it is a primary or foreign key. Relations carry crow’s foot marks so the side that holds the key is visible at a glance, and relations recovered from column naming rather than a declared constraint are drawn dashed — the picture never claims the database says something it does not.
Which formats can it read?
ErdDocs reads ten formats: PostgreSQL, MySQL, SQLite and T-SQL dumps, Prisma schemas, DBML, Mermaid, PlantUML, and the model files of Django, SQLAlchemy, Sequelize and TypeORM, plus a folder of Laravel migrations replayed in order. The format is detected from the text, so pasting is usually the whole procedure.
Is it free?
Diagrams up to 25 tables render in full for free, with no account, and PNG and SVG exports are free as well. Larger schemas are still parsed completely — the tables past the limit appear as locked placeholders so you can see the shape — and $9 once lifts the limit and unlocks the printable data dictionary.
Related
- ER diagram — what the notation means, and where the conceptual model ends and the schema begins.
- ER diagram tool — the same generator, framed against the drawing suites.
- ER diagram symbols — every mark with its reading, crow’s foot next to Chen and UML.
- All ten input formats — what each one is read from and what it produces.
- Data dictionary generator — the same schema as a written document instead of a picture.
- Example schemas — eleven domains with the SQL to paste.